A guitar cab you build instead of pick
Cab simulation mostly means impulse responses. Someone mics a real speaker in a real box, captures it, and you flip through a folder of them until one sounds right. That works, but you can't reach inside one. You can't ask what happens if the cone paper were a bit stiffer, or the dust cap heavier, or the mic tilted ten degrees.
So I built a cab where the knobs are the speaker. It's in Circuit Bench, the workbench I use for everything in this project. The cone paper's stiffness, density, thickness and damping are knobs, and so are the cone's depth and profile, the ribs, the dust cap, the surround, the magnet, the box volume, and the mic's position, distance, angle, capsule size and pickup pattern. There's a live cross-section of the speaker that redraws as you turn them, and it shows the cone actually moving.
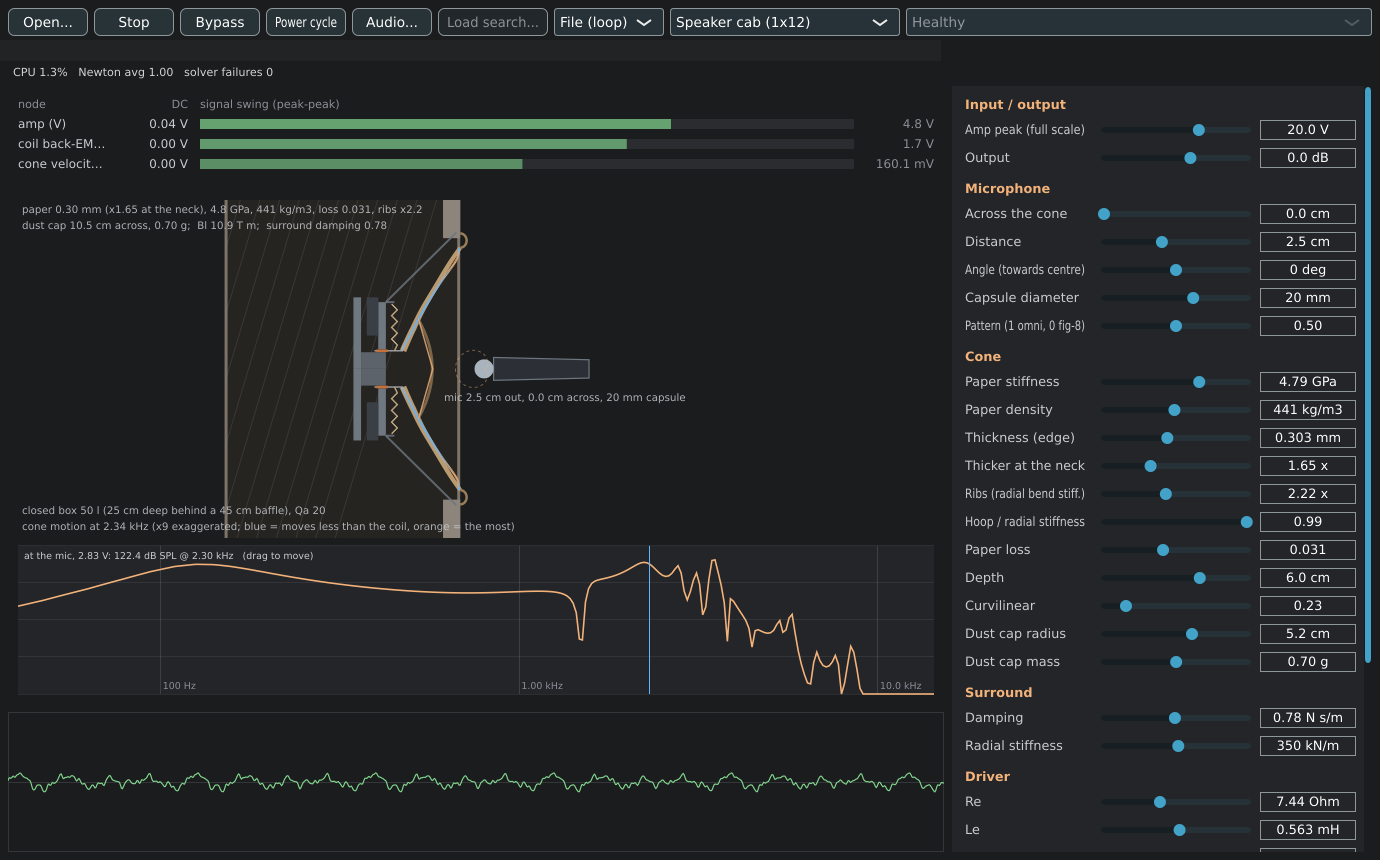
Physics in, impulse response out
Most of a speaker is linear. Only the motor misbehaves: the voice coil leaving the magnetic gap, the suspension stiffening, the coil heating up. So the model is split in two.
- The driver and the box run as a circuit. It's the same netlist engine that runs the fuzz and tube circuits, solved every sample. Loudspeaker people have written drivers as circuits forever. Mass becomes a capacitor, the suspension's springiness an inductor, the air in the box another inductor. The trick that made it drop straight into my engine is that the magnet and coil (the Bl product) and the cone area both turn into ideal transformers, which the engine already had. It lands exactly on the closed-box resonance and Q the textbook formulas predict, and on ngspice running the same circuit.
- Everything after the cone runs as an impulse response, rebuilt whenever you move a knob. That covers how the paper flexes, how the sound gets to the mic, and what the mic does with it. Nothing in there is a captured recording. The IR is computed from the geometry.
The IR half is where it gets interesting.
The cone is a finite-element model of a paper shell. It's about a hundred rings from the voice coil out to the surround, each with stretching and bending stiffness, the dust cap glued on partway out and the surround holding the edge. At low frequencies the whole cone moves with the voice coil like a piston. Above about a kilohertz it stops: bending waves ripple out across the paper, the outer cone lags and flops, and the treble comes mostly from the middle. That's breakup, and it's the voice of a guitar speaker. I checked the model against the exact solution for a flat plate driven at its hub, for both bending and stretching, and it matches to a few hundredths of a dB.
The mic is in the near field, an inch from a twelve-inch radiator. Every patch of the cone is a different distance away, so sound from each patch arrives at a slightly different time, and above breakup different parts are moving in opposite directions. The model sums every patch's contribution with its real delay, the Rayleigh integral. Then it averages that over the mic's diaphragm and mixes pressure and pressure-gradient pickup for the pattern. Proximity effect falls out of the geometry on its own. That's why moving the mic from the dust cap to the edge of the cone changes the sound the way it does in a real room, instead of being a tone knob someone labelled "mic position."
The same fuzzed riff through the same cab, the mic 2.5 cm out, first on the dust cap and then at the edge of the cone.
The cone matters more than I expected
This was the surprise. I assumed the cone would be a detail on top of the driver's specs and the mic placement. It isn't. Change the paper and the whole upper midrange rearranges itself.
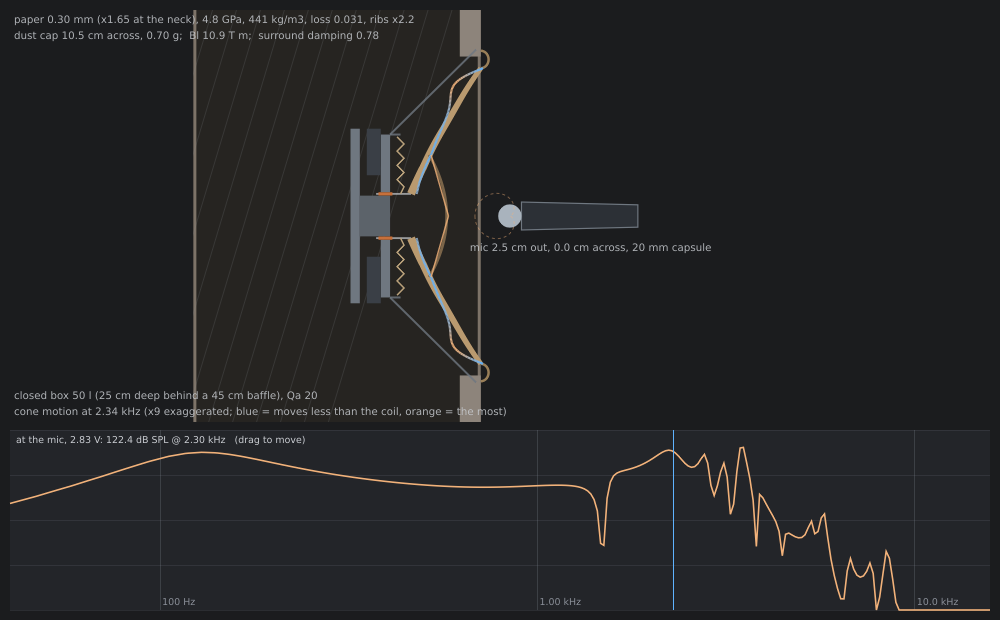
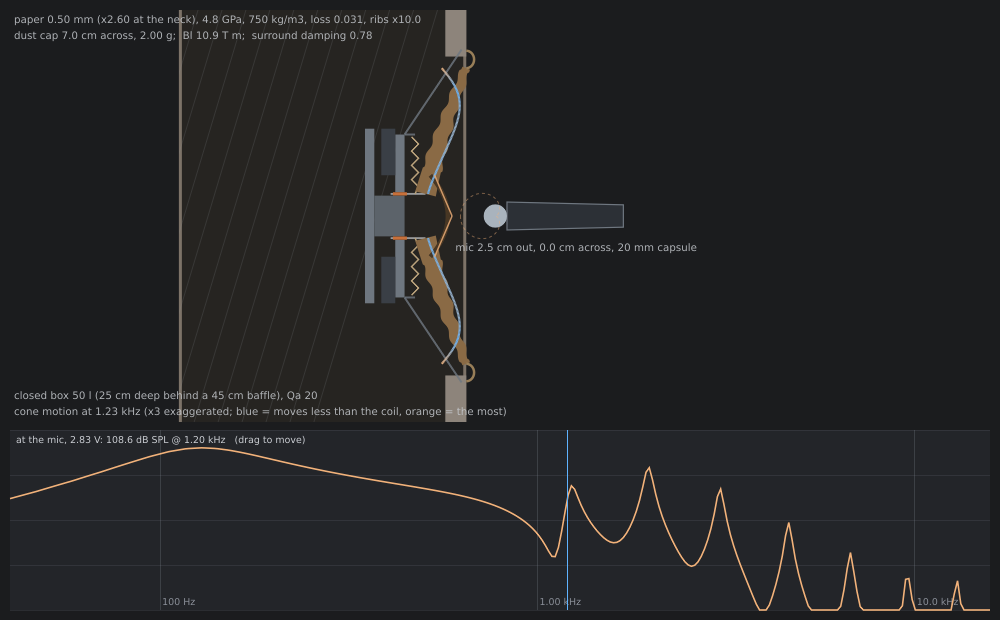
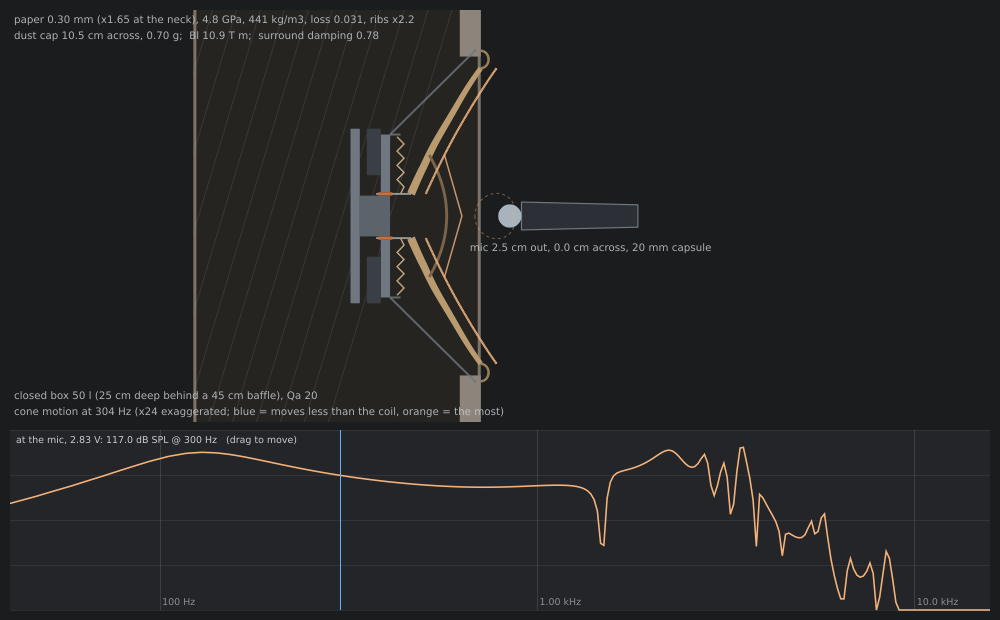
Same magnet, same coil, same box, same mic. Only the cone changed: shallower, ribbed, thicker and denser paper, and a smaller, heavier dust cap. The smooth presence hump turns into a comb of peaks and notches. You can see why in the drawing. Drag the cursor across the response strip and the cone animates its actual deflection shape at that frequency, blue where it moves less than the voice coil and orange where it moves most.
Calibrating against a real speaker
Physics you can't check against something real is just a nice picture, so I calibrated the whole thing against a published datasheet. It's a popular American 12-inch guitar speaker whose maker publishes the full Thiele-Small set and an anechoic response chart. The chart in the PDF turned out to be vector graphics, so I pulled the curve out of the PDF's drawing commands exactly instead of tracing a picture.
With the driver taken straight from the datasheet and no fitting at all, the low end landed within a dB or two of the published curve. The cone was another story.
My first fit only worked with paper five times stiffer per gram than any paper can be. That's what a model says when it's missing physics, and it was. I had the circuit driving a fixed moving mass. But once the cone breaks up, the outer part decouples, and the air load on the cone mostly disappears above a few hundred hertz. So the voice coil is pushing much less mass and moves faster, which is the broad presence lift guitar speakers have. Once the cone's real, frequency-dependent load went back onto the motor, the fit came in at 2.2 dB RMS from 80 Hz to 6 kHz with ordinary paper values.
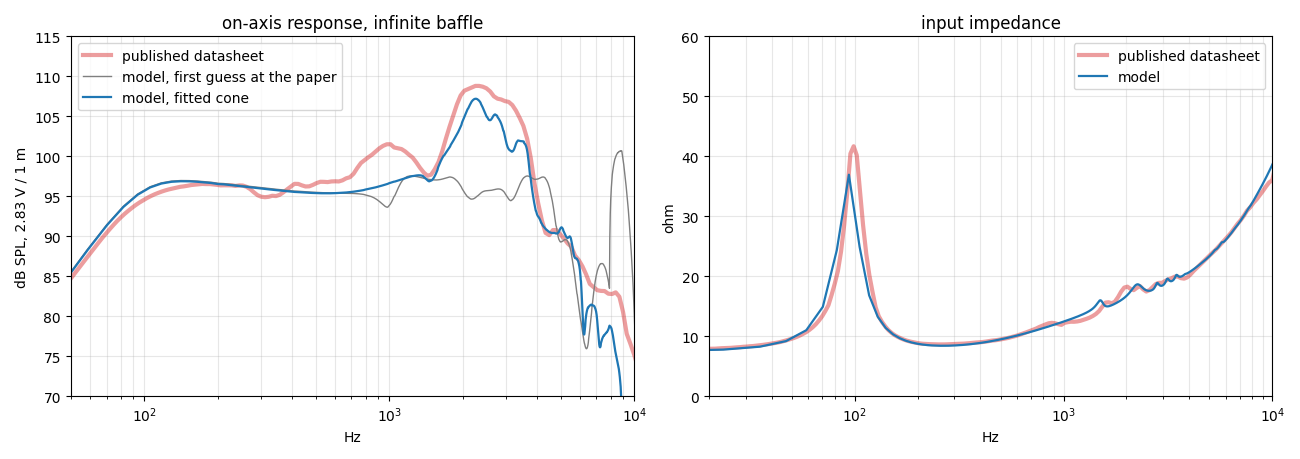
The part I like most is on the right. The datasheet's impedance curve has little bumps from 1.5 to 3.5 kHz, where the cone's breakup kicks back on the voice coil. The model has them in the same places. I never fitted to those. They come out of the cone model.
Realtime
The circuit runs every sample. The IR runs through a partitioned convolver, adding a third of a millisecond of latency. When you turn a knob, a background thread rebuilds only the part that changed:
- about 80 ms for a mic move;
- 45 ms for the cone;
- 3 ms for the driver.
The new IR crossfades in. In the Bench it all uses about one and a half percent of a CPU core.
Next
- The driver's own misbehaviour: the coil leaving the gap on big low notes, and the coil heating up and compressing.
- The box as a box: standing waves between the panels, and an open back where the rear wave wraps around.
- Damage, which is why I built it this way: holes in the cone, a partly burnt voice coil, a torn surround. Each one is a physical change to a model that already knows what the cone is, rather than a new recording.
- Real cab IRs: tuning the model against IRs with known mic positions, which will say how right the mic placement is, not just the on-axis response.
After that it probably becomes a plugin.